
Materials Testing Laboratory

Objectives:
To develop a Working Model simulation of a simple gas gun used to accelerate a projectile at a metal
matrix composite target. Impact of the projectile applies a high dynamic load to the sample for the
purpose of determining certain of its physical properties.
In order to simulate this system the student will have to be introduced to certain general ideas related to pneumatic systems and in particular to the connection between gas expansion in such a system and the thermodynamic theory of an isentropic process. This should result in the student gaining more experience in programming Working Model to simulate a complicated force which has to be dynamically calculated in time as the simulation runs.
A secondary objective is to have the student take results from a Working Model simulation and use them in a spread sheet program, Excel, to create a plot for inclusion in the project report.
Background:
As has already been indicated the system to be examined in this module is a pneumatic gas gun which is a component of URI's material testing laboratory and is actively being used to test certain metal matrix composites. If you want to see this I am sure Professor Shukla would be glad to show it to you if you asked.
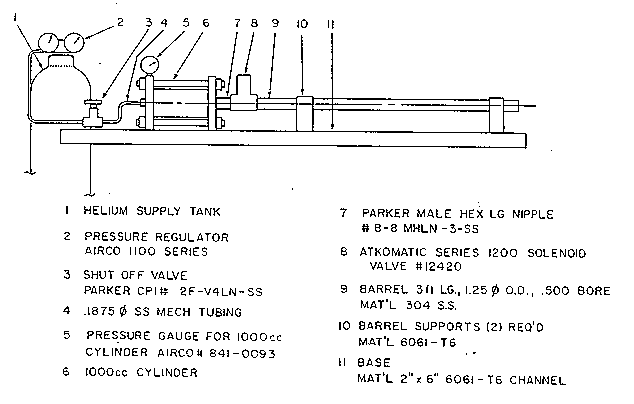
This experimental apparatus was recently designed by a graduate student as part of his master's thesis research. Figure 1 is a labeled drawing of the facility giving dimensions of certain critical components such as #9, the barrel and number #6, the cylinder. This 1000 cc cylinder represents a gas storage volume which in pneumatic terminology is often called an accumulator.
The operation is simple. A 20 gm projectile, whose diameter is very nearly equal to that of the barrel, is inserted into the gun and pushed to the rear of the barrel with a ram rod. Then the accumulator is charged with high pressure helium from a gas bottle with valve 8 closed and valve three opened until a desired pressure is reached as read from gage 5. Because the gun is charged from a gas bottle the practical upper range of gas pressure is 200 psi. Then valve three is closed and the gun is fired by quickly opening valve 8.
This results in the projectile being accelerated down the barrel. Initially the projectile is acted upon by a force from behind which is caused by the helium gas in the accumulator, and a force from in front caused by the presence of atmospheric air. These forces are each equal to the respective pressure multiplied by the cross sectional area of the projectile and they oppose each other. In fact, to simplify the problem somewhat these are the only forces that will be considered in your simulation. Therefore, we will neglect any frictional interaction between the projectile and the walls of the barrel, and we will neglect the extra force which is necessary to accelerate the atmospheric gas in the barrel ahead of the projectile as it moves along. After you complete the project you might just think about what effect these neglected forces would have on your results if you where to include them and in your discussion comment on if you think the work necessary to incorporate them into working model would be justified.
As the projectile begins to move and pick up speed the atmospheric pressure acting on its front face remains constant while the pressure from the helium acting on its rear face continues to decrease. This is because there is a finite mass of gas behind the projectile, contained in the combined volume of the accumulator plus the traversed barrel volume. As this total volume increases the gas expands so as to keep it full and hence the gas pressure falls. Before you can simulate this behavior you will need to be introduced to some simple results from thermodynamics concerning isentropic expansion.
Lastly, part of the design problem related to the gas gun facility was a calibration experiment. That is, even though the apparatus was designed using both Newtonian mechanics and thermodynamics it was necessary, because of simplifying assumptions, to actually perform tests to determine the relationship between the set pressure in the accumulator and the projectiles velocity upon leaving the barrel.
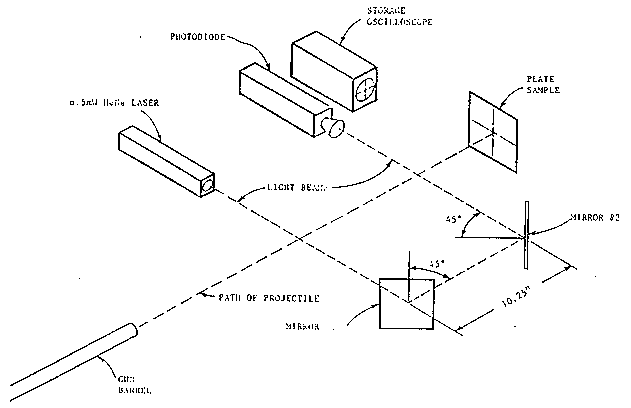
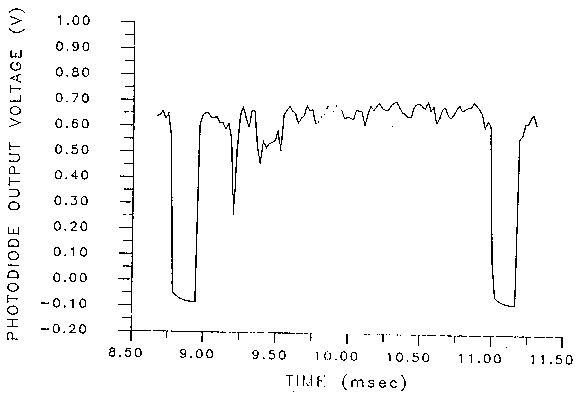
For background information, Figure 2 shows the very clever experimental set up used to measure the projectiles relatively high velocity for calibration purposes. It consists of a laser which puts out a light beam which is directed through two ninety degree turns by mirrors so that it crosses the path of the projectile twice before striking a photodiode detector. This detector puts out a constant voltage when illuminated by the laser beam, but its out put drops to near zero when the laser beam is interrupted. Figure 3 shows the trace of the detectors voltage as a function of time from the storage oscilloscope as the projectile passes down range for a typical run. Note the two large and broad downward spikes in the voltage marking the passage of the projectile first through the first beam and then through the second beam. Knowing the distance between the two beams, which may be adjusted by the position of the mirrors, the velocity may now be determined. In fact this can be done twice. First by measuring the time difference between a point on the front face of each spike at some constant voltage level, and then by finding the difference between points on the back face of each spike. The front faces define the times at which the front of the projectile first encounters the laser beam, while the back faces define the times at which the rear of the projectile clears each beam. Note that using all this information leads to a verification of the validity of a velocity measurement. First of all the value obtained from the front end measurements should agree with that from the rear end, and then knowing the velocity and the width of each spike allows for the calculation of the thickness of the projectile. If this is not in reasonable agreement with the actual size of the projectile something is wrong and the experiment should be repeated. The last data value need for each calibration run is the accumulator pressure before firing. This is read from gage #5 as shown on Figure 1.
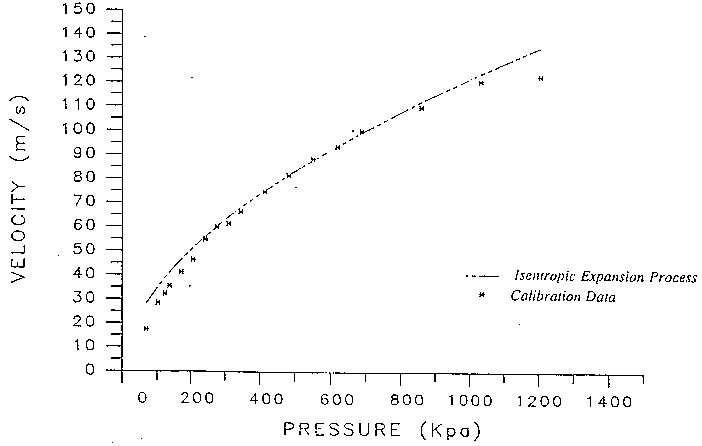
Figure 4 summarizes all the calibration data. The actual data points are shown by plotting an asterisk (*). The student who performed the experiment curve fit the data and the result was

(1)
where V = velocity in meters/sec. and P = accumulator pressure in Pascals. Note also that there is a broken line curve on the figure labeled Isentropic Expansion Process. This was a prediction made by the student of the velocity pressure curve using the isentropic assumption and involving the solution of a complicated differential equation. In this module you will endeavor to generate a similar result using Working Model. It turns out that this is much easier.
Isentropic Gas Expansion:
Thermodynamics teaches that when a gas expands the relationship between its pressure and its volume may be described by what is called a polytropic process equation. The form of this is

(2)
where Po and Vo are the initial values of pressure and volume. If a gas flow is adiabatic, which means that no heat transfer is involved, and if it is slow enough so that frictional effects may be reasonably neglected it is said to be reversible (really meaning no energy dissipation has occurred). Such flows, adiabatic and reversible are said to be isentropic meaning possessed of constant entropy. Remember these terms because you will learn much more about them when you take thermodynamics. For our flow in the gas gun one may very reasonably neglect heat transfer because the entire process is so rapid, but it is much harder to justify neglecting frictional effects especially since the gas must flow from the accumulator through a valve (admittedly open) and then into the barrel. In any event we will assume isentropic flow and evaluate the suitability of this assumption by comparing our results to the calibration data as represented by Equation (1).
As a practical matter this means that we will assume Equation (2) is valid and then all that is needed is knowledge of that special value of K which makes (2) describe an isentropic expansion and not some other kind. It turns out that the value of K appropriate to helium is K=1.6 ( the value of K for air is 1.4).
With this understanding in mind it follows that the net force on the projectile is given by

(3)
PA is the atmospheric pressure and A is the cross sectional area of the projectile (essentially the bore of the barrel). Vo is the initial volume of the gas and equal here to the accumulator volume. Since V is the instantaneous gas volume it must equal the sum of the volume of the accumulator and of the traversed length of the barrel . So

(4)
and combining (3) and (4) gives

(5)
Summary of Problem Requirements
Create a Working Model simulation of the projectile in the gas gun. Give this the correct mass (20 gm) and apply the force represented by Equation (3) in the x direction. Have this force turn on at t=0 when x=0 and turn off when x = length of the barrel.
Create both graphic and digital output meters to monitor the force, the velocity and the position of the projectile.
Create an input meter to adjust the accumulator pressure (max 200 psi ) watch units so that force comes out in some consistent unit. Velocity should be in m/s and you may in fact want to work with pressure in Kilopascals to correspond to Figure 4.
Exercise your simulation to cover the range of data on Figure 4. Each time you make a computer run record the selected accumulator pressure and the resulting end velocity.
When this is completed take your resulting values, enter them into Excel, and plot them like is done on Figure 4. On this same figure plot Equation 1.
Hand in a print out of your Working Model window showing the results of a typical run, your plot from Excel, and a brief written discussion of your results generated on a word processor.


