Raccolta casi Working Model, visualNastran & SimWise - Vehicle - pedestrian crash test
Contatto Editoriale:
Paolo Lista,
Lista Studio srl®
Borgo Belvigo 33, 36016 Thiene Vi ITALY
tel/fax 0445,372479 o info@lista.it
MULTIBODY NUMERICAL SIMULATION FOR VEHICLE – PEDESTRIAN CRASH TEST
AND ANALYSIS OF CHARACTERISTIC PARAMETERS
Prof. Gabriele Virzě Mariotti and eng. Gaetano Bellavia (University of Palermo, Italy) have made several simulations of vehicle – pedestrian crash tests, executed by visualNastran 4D software. The evaluation of the damage caused to pedestrian is obtained following the EURONCAP directive. The vehicle virtual model, DIMA, follows closely the characteristics of a saloon car belonging to the small cars category. A total of 16 simulation tests are conduced; each characterized by different initial conditions. The vehicle advances with several speeds, at constant speed and in braking. The anthropomorphic model Dummy impacts with the vehicle in lateral or perfectly frontal position with respect to the front of the vehicle.
The following is an extract from: Gaetano Bellavia, Gabriele Virzě Mariotti - Multibody numerical simulation for vehicle – pedestrian crash test and analysis of characteristic parameters – XXI Science and Motor Vehicles 2007, JUMV international Conference with Exbition, 23-24 April 2007, Belgrade, Serbia, ISBN 978-86-80941-31-8
1. Introduction
To ensure the five stars, that is the maximum mark, in the crash tests, car houses work seriously on both the inside and on the vehicle safety set as the airbags. Many vehicles have reached the highest mark, also ones having the characteristic of small saloon car.
The same diligence is not addressed towards the other road users as the pedestrians. Today only one vehicle in Europe has obtained the maximum acknowledgement in term of pedestrian safety. Entire vehicle front parts are conceived of the pedestrian consequence reduction, in fact absorbers are inserted behind the bumper to attenuate the impact and avoid the legs bending. The bumper superior part and the bonnet lower part are more pliable to protect the leg; bonnet and the relative framework are dimensioned to attenuate the head crash. Moreover the vehicle of the above is the only with active bonnet for the pedestrian protection; if a pedestrian is crashed, the device lifts the bonnet at the hinges level, increasing the distance from the rigid mechanics elements, absorbing the strain energy and limiting the head – bonnet impact.
Fig. 1 shows the views of a plausible design of a normal vehicle of mean segment, for the simulation of the pedestrian – vehicle crash test, without any examination of the problems regarding the aerodynamics or the use of the spaces.
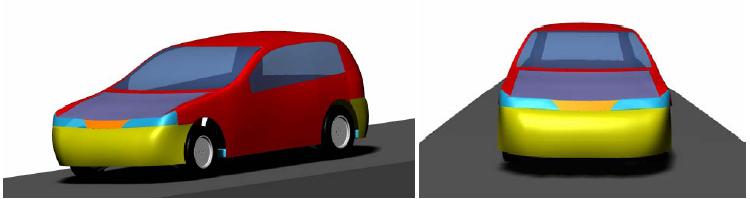
Fig. 1: Perspective and front view of DIMA.
2. Vehicle Design and structural parts
The virtual vehicle model is named DIMA and belongs to the segment of mean vehicles of recent conception. CAD software is used for the vehicle modelling and the final result is imported in Visual Nastran room for the simulations.
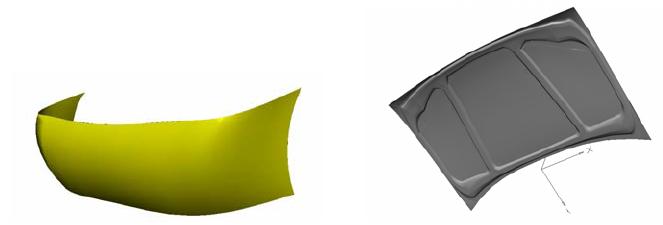
Fig. 2: Bumper and bonnet particulars.
To design the vehicle front, in order to result less dangerous for the pedestrian, the very stiff parts are limited, reducing the thickness of the lateral bundles of the bonnet; the front is constructed without very acute angles, bonnet natural position is not very high and the mean length is not too reduced. The geometrical and mass characteristics of the vehicle are the following:
To dissipate the greatest possible energy quantity, the bumper (fig. 2) is supposed in a material with high crash absorbing coefficient as the polyurethane foam; it is constrained in order to provoke the easy deformation of the anchorage points. This characteristic is imposed using the constraint linear spring/damper in Visual Nastran, in order to allow the movement possibility along the longitudinal vehicle axis. Moreover the bonnet deformation may not be too great, because it is limited by the stiff part in the motor space; the bonnet is constrained by a linear spring/damper, imposing that the maximum excursion is not greater than 20 mm.

Fig. 3: Front and back Mac Pherson suspension of DIMA vehicle.
2.1 Suspension set
The cinematic complex constituting the suspension permits the relative motion between the wheel, following the road profile, and the vehicle body. Geometrical schemes and angles values characterizing the suspension have to be maintained during the motion. Angles values have fundamental importance in the vehicle dynamics, so that their choice permits the achievement of particular behaviors in curve. Today the more common independent suspension is Mac Pherson one; it is used indifferently for front and rear suspension, with or without traction on the axis. The highest end of the damper is constrained by a spherical joint to the chassis (fig. 3); it permits the little movements in all the directions, while the lowest end of the damper is constrained to the wheel hub; the spring is compacted and inserted in the same way of the damper. Visual Nastran does not need the geometry of these parts, if they are substituted with opportune constraints with adequate characteristics.
Introducing a local system of reference for each axis, the dimensions of the inferior suspension arm can be found, measuring the spatial coordinates of the silent block on the chassis and on the head of the wheel hub, and the coordinate of the spring. Fig. 3 shows the suspension built in Visual Nastran, with the constraints.
The tyres have the measure typical for vehicles of this class: 175/65R14. The rims are mounted on the hub by the constraint Revolute Motor, permitting the rotation around an axis as a revolute joint; it permits the simulation of the motor traction with the application possibility of angular speed, angular acceleration or angular displacement (fig. 4). It is used to apply an angular speed, according to a prearranged law to move the vehicle as by means of a true motor. The tyre is joined to the rim by a rigid constraint.
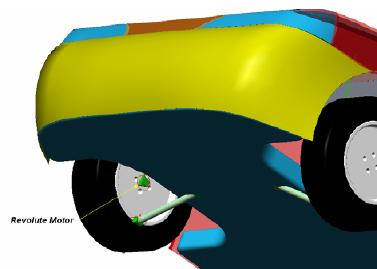
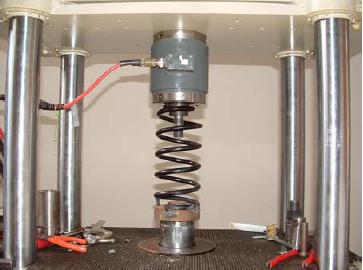
Fig. 4: Revolute Motor application on the wheel. Fig. 5: Rear carriage spring during the test.
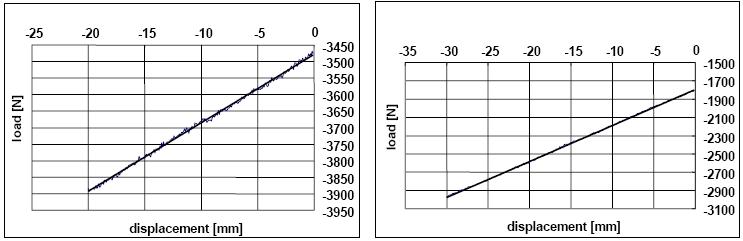
Fig. 6: Springs characteristics; fore carriage on the left, rear carriage in the right.
The value of the spring elastic constant is obtained by an experimental test: two springs, respectively coming from the front and rear carriage of a very similar vehicle, were tested on MTS system (fig. 5). A preload equal to 3500 N is applied to fore carriage spring, constituted by 3 active coils enveloping a frustum of cone; the preload on the rear carriage spring, constituted by 4 active coils enveloping a cylinder, is equal to 1800 N; fig. 6 shows the characteristic curves obtained by experimental data elaboration. Both the graphs show the linear behaviour of the springs. The following values are obtained interpolating the experimental data (1):

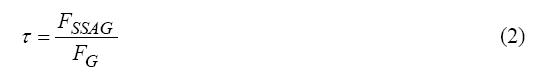
These results are confirmed by a theoretical calculation. Fore carriage spring is less stiff than rear carriage one, while the contrary should occur in the common practice. In reality it is true for the ground stiffness, representing the true stiffness of the suspension system; the load on the Spring – Shock Absorber Group is greater than the load between wheel and ground due to the transfer trough a lever system. The ratio is named suspension ratio (or lever ratio), that is:
The difference is due to the fact that the front and rear suspension ratios are different. The constraint Linear Spring/Damper in Visual Nastran foresees the assignment of both the actual length (in working, under preload) and the natural one; the last are:
The simulator permits the introduction of one value of damper constant for each wheel; in reality al least two values should be necessary, because the shock absorber has an asymmetric behaviour, reacting in compression with a lower force than in extension; the damper reaction is proportional to the displacement speed. The assigned value has to be a reasonable compromise; often the optimum constant damper for the comfort is increased to improve the vehicle characteristics on the road, so that, comparing with the vales of dampers mounted on similar vehicles, the following values are chosen:

3. Pedestrian - vehicle crash test
Car houses implement this type of test using two different approaches. The direct one aims at fulfilling of the rules into force, as EURONCAP protocol EEVC WG 17. The indirect one is based on a real reproduction of the event, reconstructed faithfully and with the wider scenario of variable parameters, following the same protocol; it is the only applied in this work, no study in depth of the direct approach is reported.
3.1. Indirect approach
Indirect approach implements the reproduction of an accident between a pedestrian, which functions are assumed by an anthropomorphic model, and a vehicle under determinate conditions. The possible trajectories assumed by the pedestrian body, as result of the collision with a vehicle, may be grouped in five probable crash schemes (fig. 7):
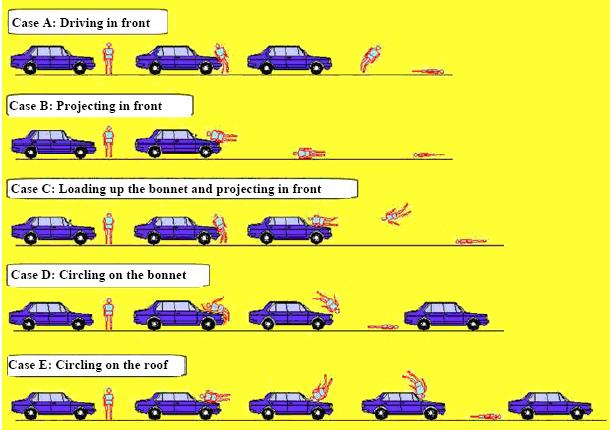
Fig. 7: Possible trajectories as result of the collision.
3.1.1 Simulation types choice and setting.
In the more general case, the pedestrian moves perpendicularly to the road longitudinal axle, with an orthogonal and negligible speed respect to the vehicle coming.
The driver of the vehicle has still an active role, in fact, he slows down the vehicle realizing the imminent danger, in the attempt of reduction of the impact consequence, and, acting on the steer, changes the vehicle direction without to avoid the impact.
It can happen when the vehicle begins to skid on the road for the interruption of the adherence conditions, due to the strong braking. The consequences on the pedestrian should be lower, reducing the speed, but the consideration has to be done that the velocity reduction is often very low, so that, taking in account the reaction time, the braking acts when the vehicle is near to the impact, or it happened, reducing the speed of 1÷2 m/s.
Other braking effect is that the fore spring – shock absorber group is put in compression, resulting more stiff to an ulterior compression action due to the damper effect; the pedestrian, loading the bonnet, benefits by the bonnet deformation for the kinetics energy absorption, but can less benefit by the absorption contribute of the suspension group.
In this work two simulation types are executed with the vehicle at constant speed and with the vehicle in strong braking. Moreover the test execution foresees the Dummy in two different positions:
In the European countries the speed limit is equal to 50 km/h in the urban territory, so that this value represents the maximum speed of the pedestrian - vehicle crash test.
The value is already very high, given that the probabilities of fatal crash increases in exponential way over 40 km/h. The EURONCAP protocol fastens the speed limit for the pedestrian vehicle crash test in 45 km/h. Fig. 8 shows the remarkable difference existing among crash at 50 and 40 km/h: the probability to suffer a lethal damage is respectively 85 % and 30 %. The simulation tests are executed in four different values of speed: 20, 30, 40, 50 km/h, for a total of 16 simulations.
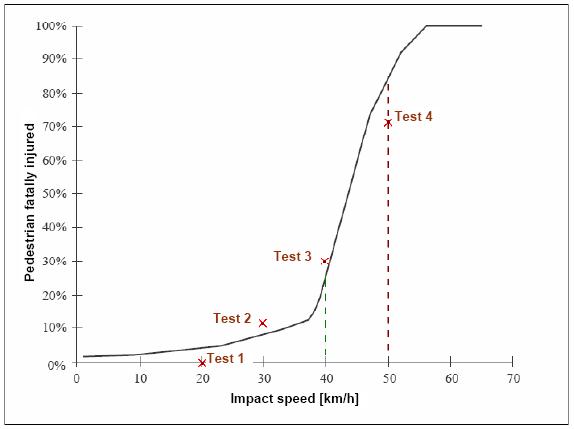
Fig. 8: Percent statistics curve of probable mortality
varying the impact speed with the points representing the simulations
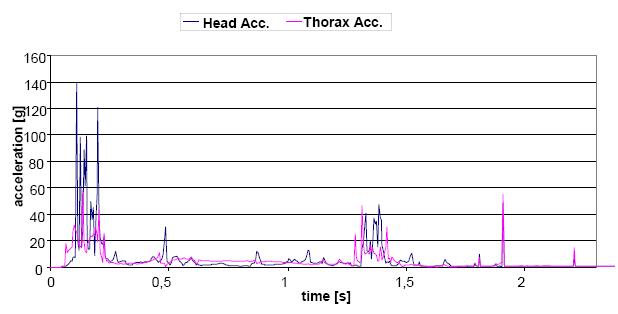
Fig. 9a - Test 4: Side impact at V=50 km/h in braking
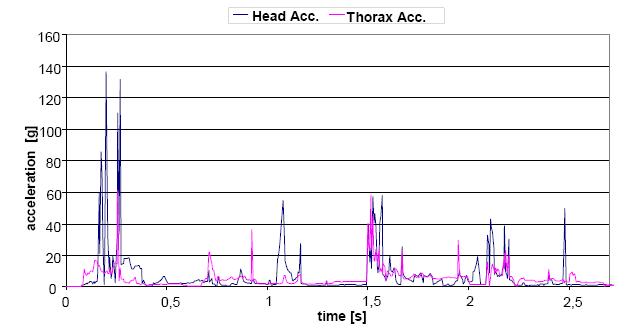
Fig.9b - Test 11: Frontal impact at V=40km/h in braking
The principal setting parameters of the tests are:
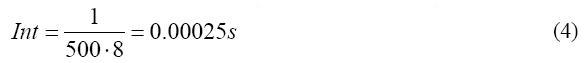
Rate frame = 500; Step of frame = 8; Integration interval:
Integration method: Kutta – Merson. The parameters measured during the tests are:
4 Results summary and analysis
Fig. 9 a and b give the measurement example by visualNastran of the acceleration during the two tests indicated in the captions. Table 1 summarizes the executed simulation tests, indicating the Dummy position and the conditions of the impact. The value of the acceleration in the head barycentre permits the HIC evaluation, according to the following relationship:
It foresees the integral calculation of the acceleration at intervals of 0.036 s, for the entire time interval representing the impact duration. In this work no evaluation is executed for the thorax damage, though all the data for TTI calculation are relieved. Visual Nastran allows the observation of the trajectory assumed by Dummy; it permits the visual association of the measured data with the photogram of the same test, for the entire impact duration.
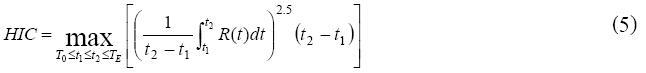
Fig. 10a depicts the pedestrian trajectory at 20 km/h, in side position respect to the vehicle in braking (test 1). Fig. 10b shows a case similar to the previous at 50 km/h (test 4): Fig. 10c depicts the pedestrian trajectory in the case of frontal impact; with a constant speed 30 km/h (test 9). The simulations reconstructions in fig. 10 are very similar to ones shown in fig. 7, so as found in the literature.
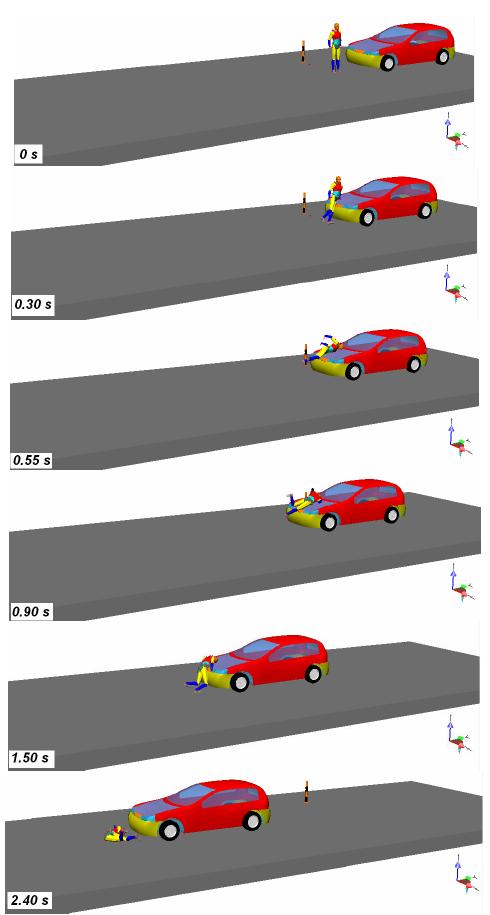
Fig. 10 a: Test 1 – 20 km/h, lateral position in braking
Click here to download this movie
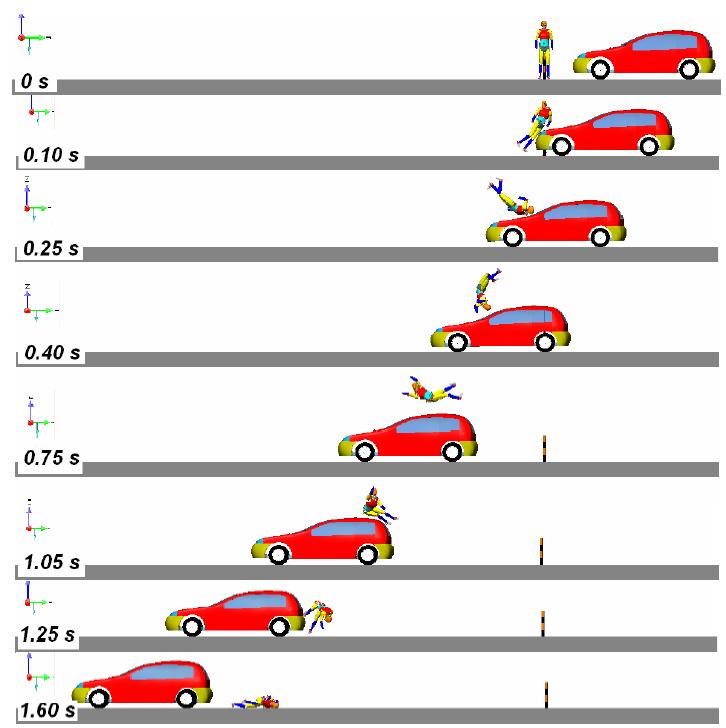
Fig 10 b: Test 4 – 50 km/h, lateral position in braking
Click here to download this movie
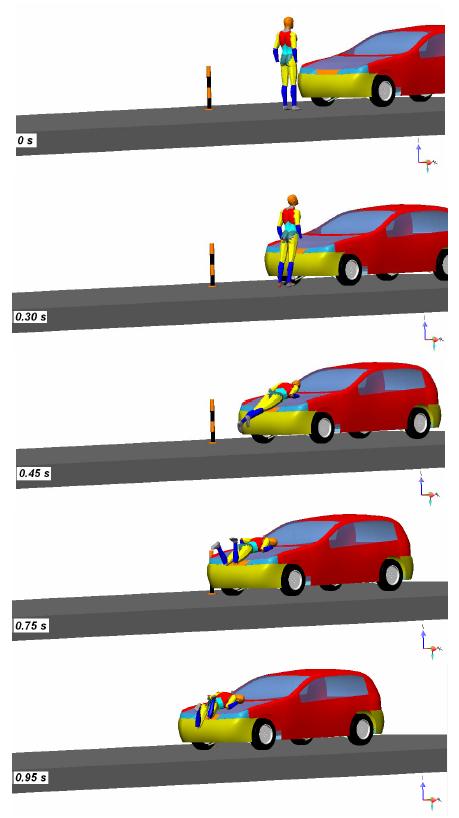
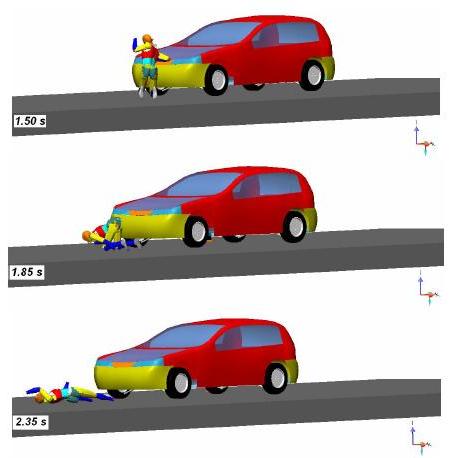
Fig. 10 c: Test 9: - 20 km/h constant, frontal position
Click here to download this movie
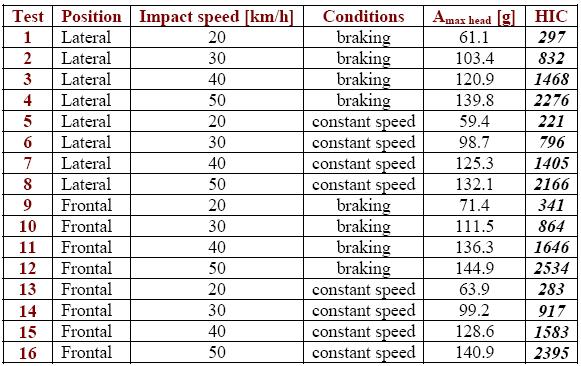
Tab 1: Simulation results
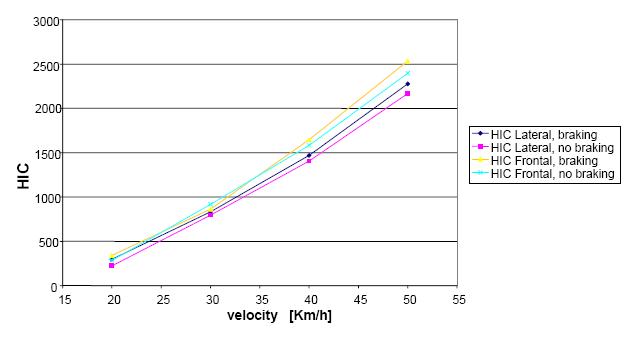
Fig. 11: HIC values comparison
The acceleration values of the head and thorax are rather similar for the several speeds, in the four test groups, though clear differences are manifested on the kinematics of every impact. The graph in fig. 11 shows the HIC increasing to increase of the speed; the vehicle in braking submits the Dummy to more onerous conditions respect to the case of constant speed: the permanence time of head and thorax acceleration picks is increased, while the lowering of the vehicle frontal part is reduced of 30 ÷ 40 % for the effects of the load transfer due to the suspension stiffening.
The lateral impacts are characterized by acceleration picks due to skull crashes against the vehicle front (bonnet and windscreen). The crashes are repeated in the short time interval of 0,01 s, due to fast head rotation around the cervical articulation. The graphs of the acceleration versus the time are very different varying the speed in the frontal impact, because the head is solicited in analogous way to the whiplash, due to first contact of the Dummy with the bonnet. In some cases the contact of the head, at the height of the jaw, is simultaneous at the thorax contact with the bonnet, so that the head acceleration decreases, while thorax acceleration increases in a remarkable way.
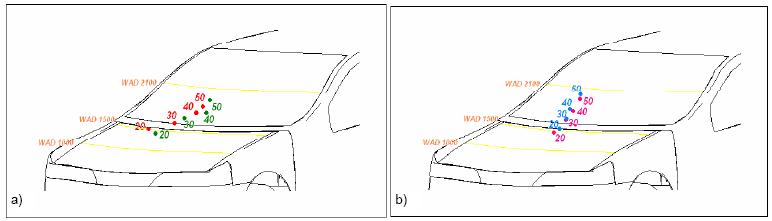
Fig. 12: Head – vehicle contact points.
a) Test 1÷8 lateral crash, b) Test 9÷16 frontal crash.
The points are marked with the speed values [km/h]
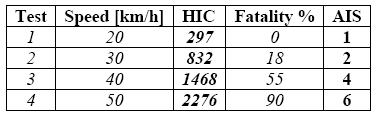
Table 2: HIC – AIS comparison
4.1 Impact points localization
The vehicle marking for the individuation of the impact areas (WAD) is executed following EURONCAP directive. Fig. 12 shows the impact points obtained by the simulations; in particular one can note:
The points are marked with the corresponding value of the speed. In the case of lateral impact the point dispersion interests a greater area than the frontal impact. The analysis of the contact points in both the cases gives an ulterior confirmation of the result accuracy; the very high acceleration picks correspond to a crash with a more stiff part of the vehicle front.
The obtained HIC values can be correlated with the lesion scale AIS, presented in the previous work. Table 2 shows the possible percent of fatality with HIC value, and the corresponding AIS value, for the first four tests only, because the analysis of the other tests reaches similar results.
The fatality values and AIS index are in good agreement with the statistical draw reported in fig. 8. The tests give the same behavior of statistical origin: a remarkable increase of mortality is obtained with small increase of the speed, and the maximum increase is reached increasing the speed from 40 to 50 km/h; the points in table 2 are also marked in fig. 8 for a visual comparison.
5. Conclusions
Virtual simulation model proposed in this work has centered the objective, so that it can be considered as base for a greater depth of the entire problematic influencing the phenomenon. Both the anthropomorphic and the vehicle models can be touchy of improvements, for the characteristic of the muscle apparatus, for the fitting of the remark points of the vital parts (brain, heart, liver etc.) and for the properties of the materials constituting the vehicle.
The reconstruction of the pedestrian - vehicle accident gives very reliable results, in line with the expectation and with the collision results, as found in the international literature. Remarkable advantage is the simulation execution with the vehicle draft, because the vehicle characteristics modification is allowed, in order to overcome the mandatory homologation tests in the pedestrian crash. The more opportune aesthetic and functional modifications may be executed in a fast and economic way.
The efficacy of the active and passive devices may be tested, as the real efficacy of bumpers in highly absorbing material, or the bonnet in composite material with reinforcement elements, or, at last, the real effectiveness of the active bonnet, that is the only protection device implemented till now.
Possible development can be the study of the accident dynamics; the simulation with the purpose of the accident reconstruction opens a new research field interesting the safety.
REFERENCES
OTHER 83 DIFFERENT APPLICATIONS !
ALTRI 83 CASI IN SETTORI DIVERSI !